
Rheocor v3.0: Cardiovascular Risk Ensemble
A four-model ensemble (Logistic Regression, Random Forest, XGBoost, and a small MLP) trained on the UCI Cleveland Heart Disease dataset, with cross-validated confidence intervals, multi-method SHAP/LIME/Gradient explainability, federated-learning compatibility (FedAvg), and temporal risk projection.
1. Intended use
RheocorAI is intended as a research and educational tool to demonstrate explainable cardiovascular ML. It is not intended for clinical decision-making, and is not a regulated medical device.
- Primary users. ML researchers, clinical-informatics students, public-health educators.
- Out-of-scope uses. Triage, diagnosis, treatment planning, screening, or counselling of identified patients.
2. Dataset
- Source. UCI Heart Disease dataset, Cleveland subset (Detrano et al., 1989; Janosi et al., 1988).
- Size. 13 standardized clinical features. Class balance ≈ 46% positive (any disease) / 54% negative (no disease).
- Features. Age, sex, chest-pain type, resting BP, cholesterol, fasting blood sugar > 120, resting ECG, peak heart rate, exercise angina, ST depression (oldpeak), ST slope, fluoroscopy vessels, thallium stress test.
- Splits. 80/20 stratified train/test split (seed 42; test set touched once, at evaluation), plus 5-fold stratified CV over the full dataset for the headline metrics.
- Pre-processing. Split first; the 6 missing cells imputed with training-set medians;
StandardScalerfit on training rows only; binary target collapsed from the 0–4 severity scale. Cross-validation re-fits imputation and scaling inside every fold.
3. Model architectures
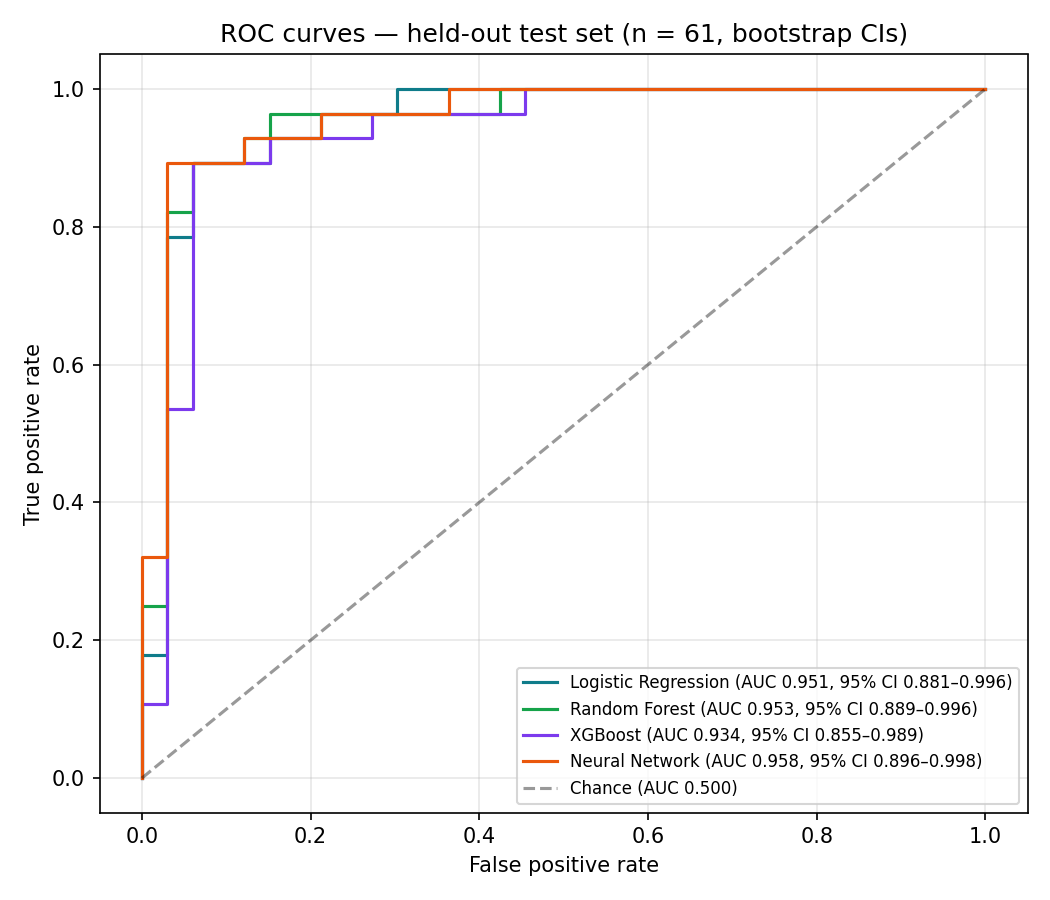
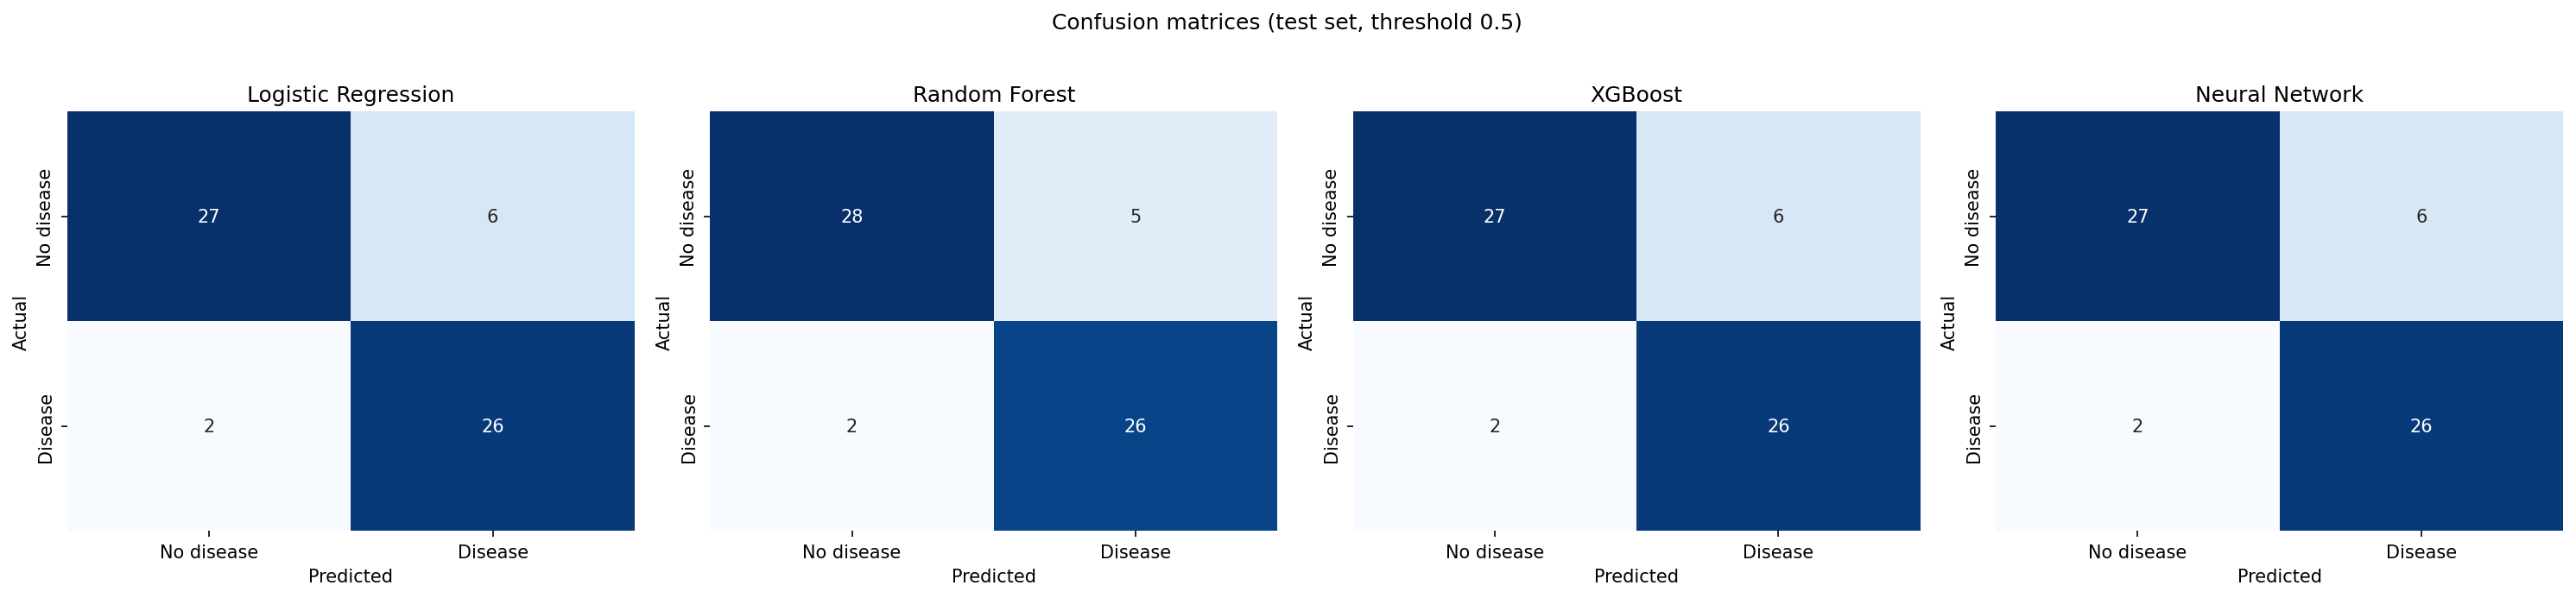
max_iter=2000 · L2-regularized.max_depth=6 · bootstrap.max_depth=4 · lr=0.05 · subsample 0.9.4. Performance: 5-fold cross-validation (full dataset)
Federated learning is a single-machine simulation (FedAvg, 3 simulated sites × 25 rounds × 5 local epochs): the aggregated model converges to within noise of the centrally-trained baseline on the 61-row test split. With n=61, differences of ±0.01–0.02 AUC between the federated and centralized runs are not meaningful. The result demonstrates convergence, not superiority.
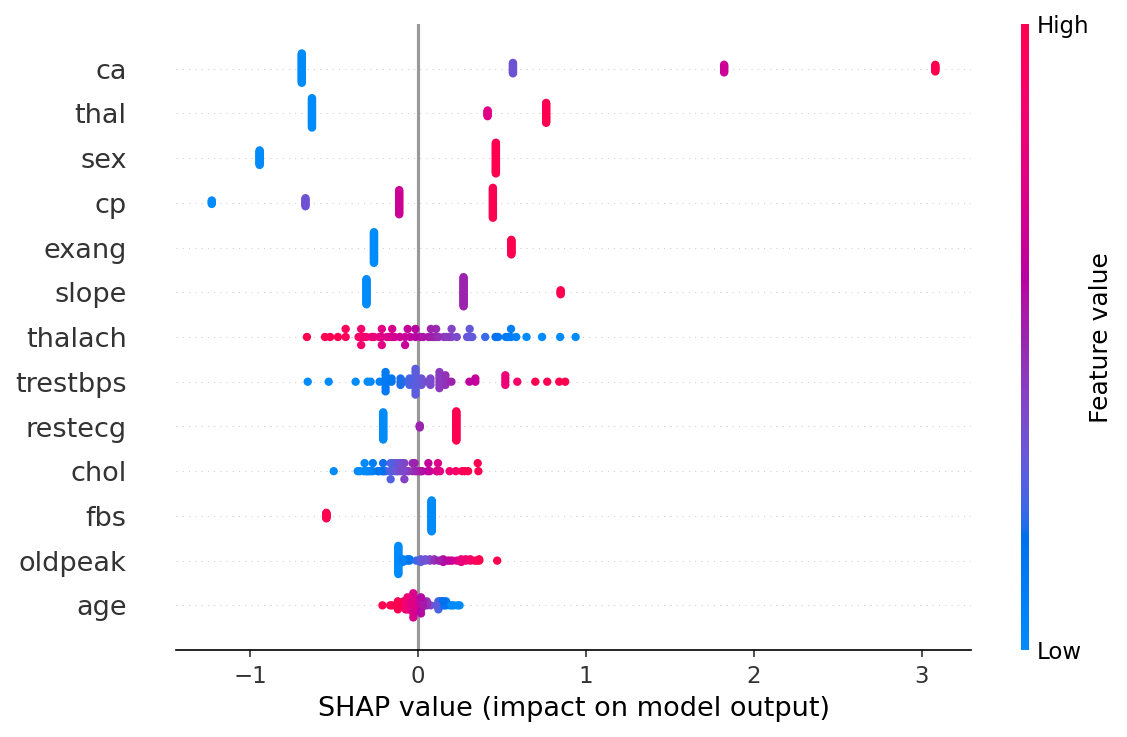
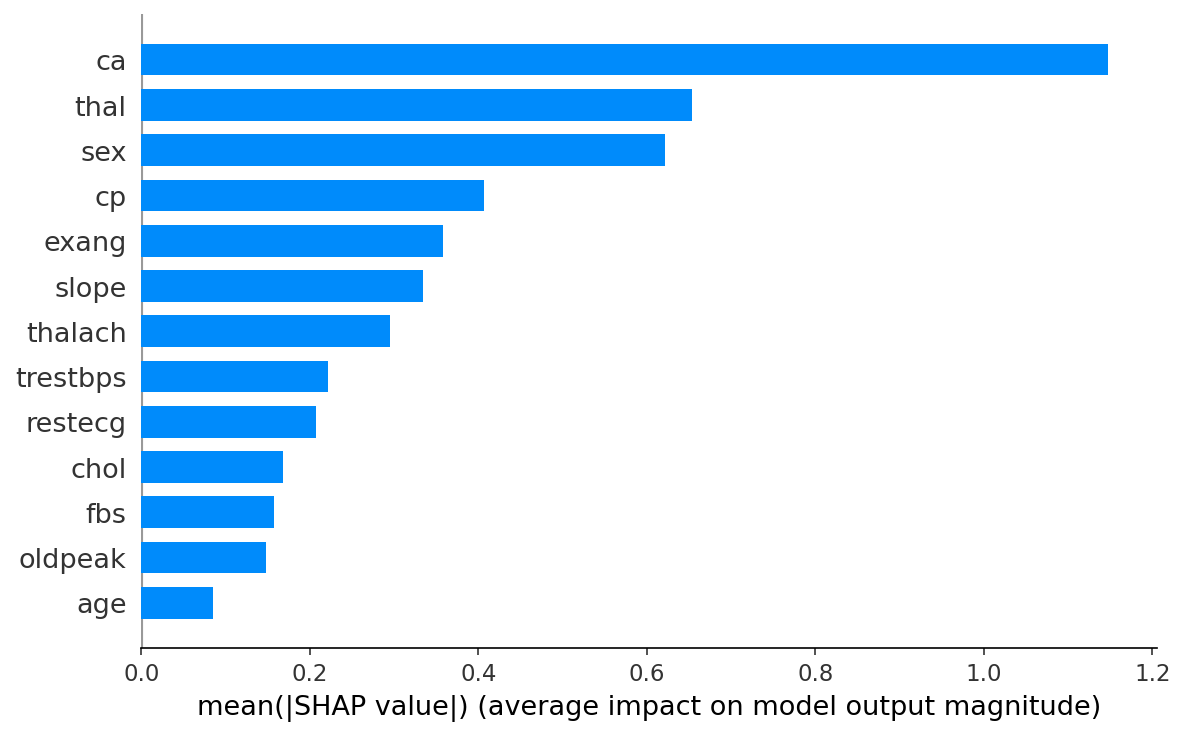
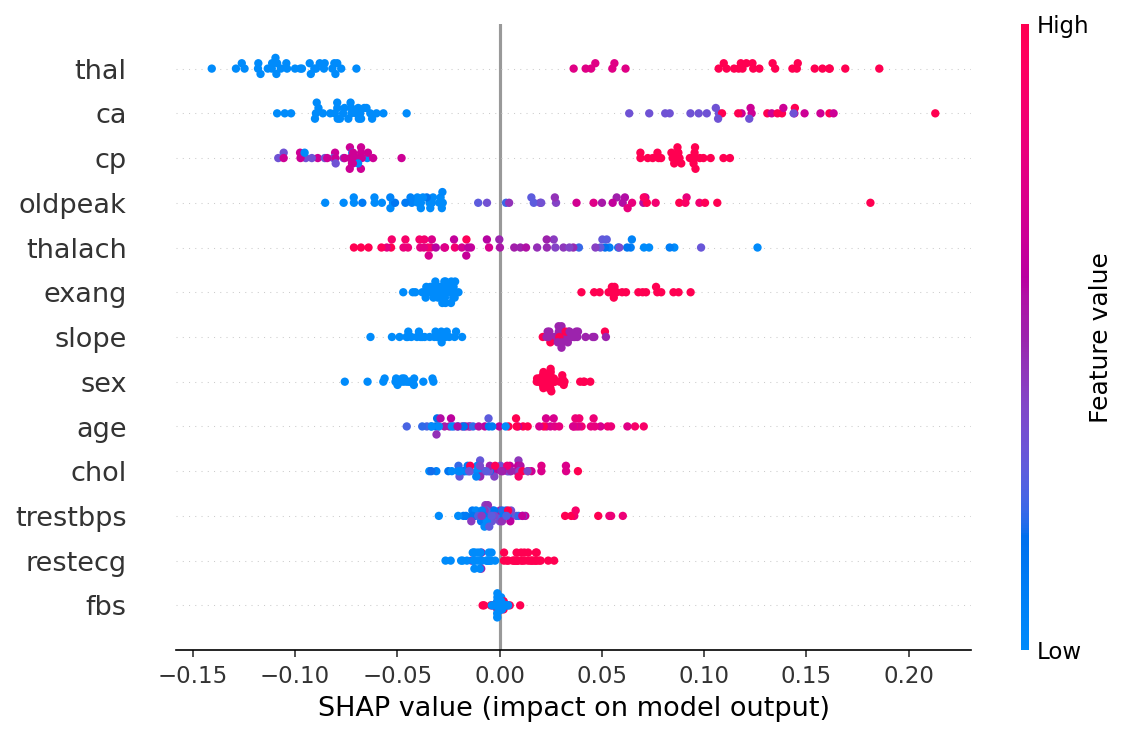
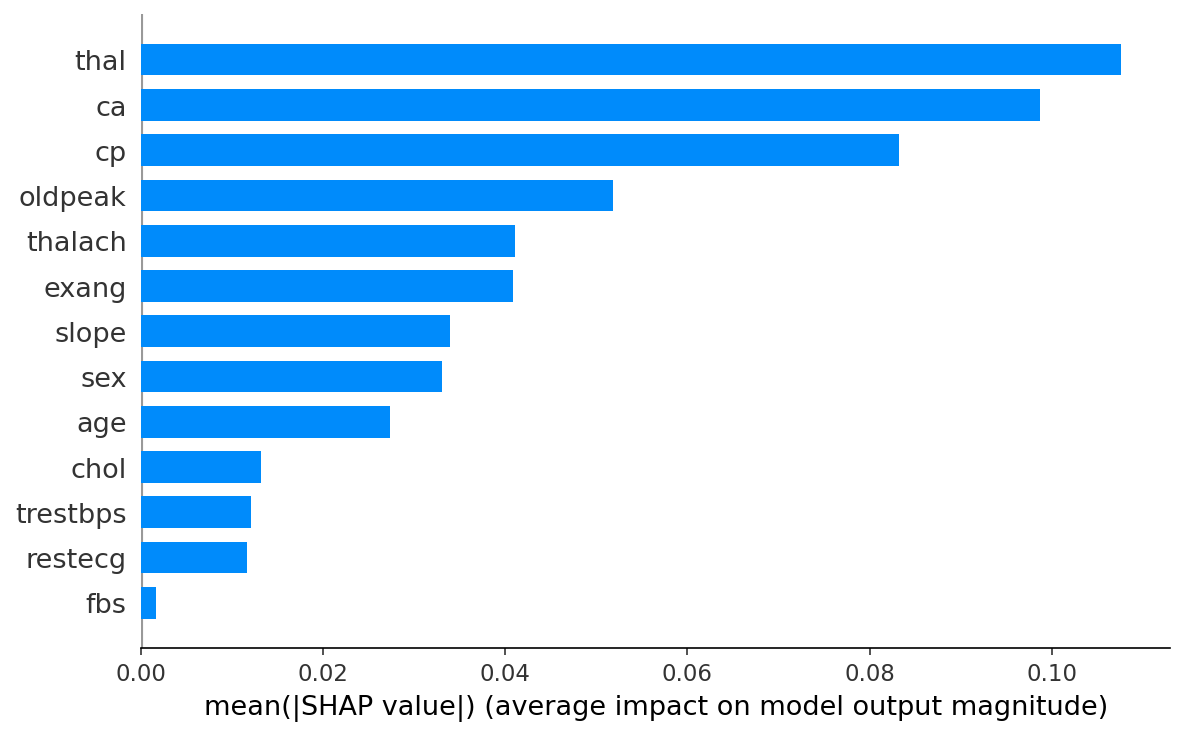
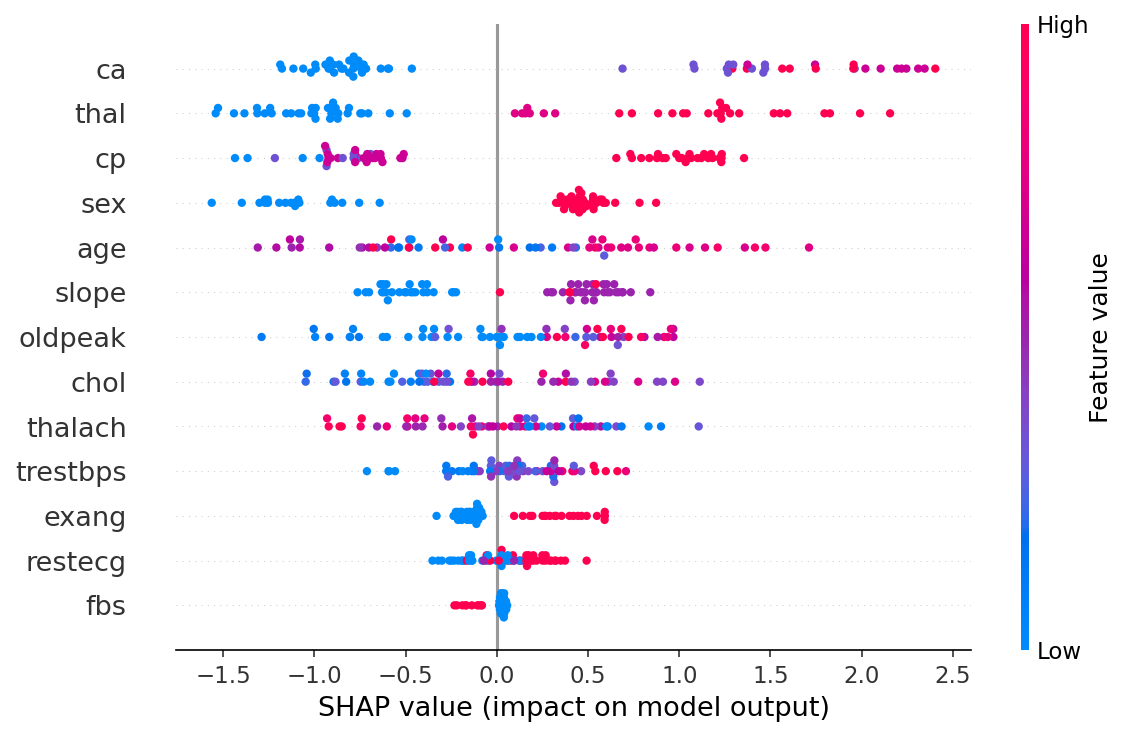
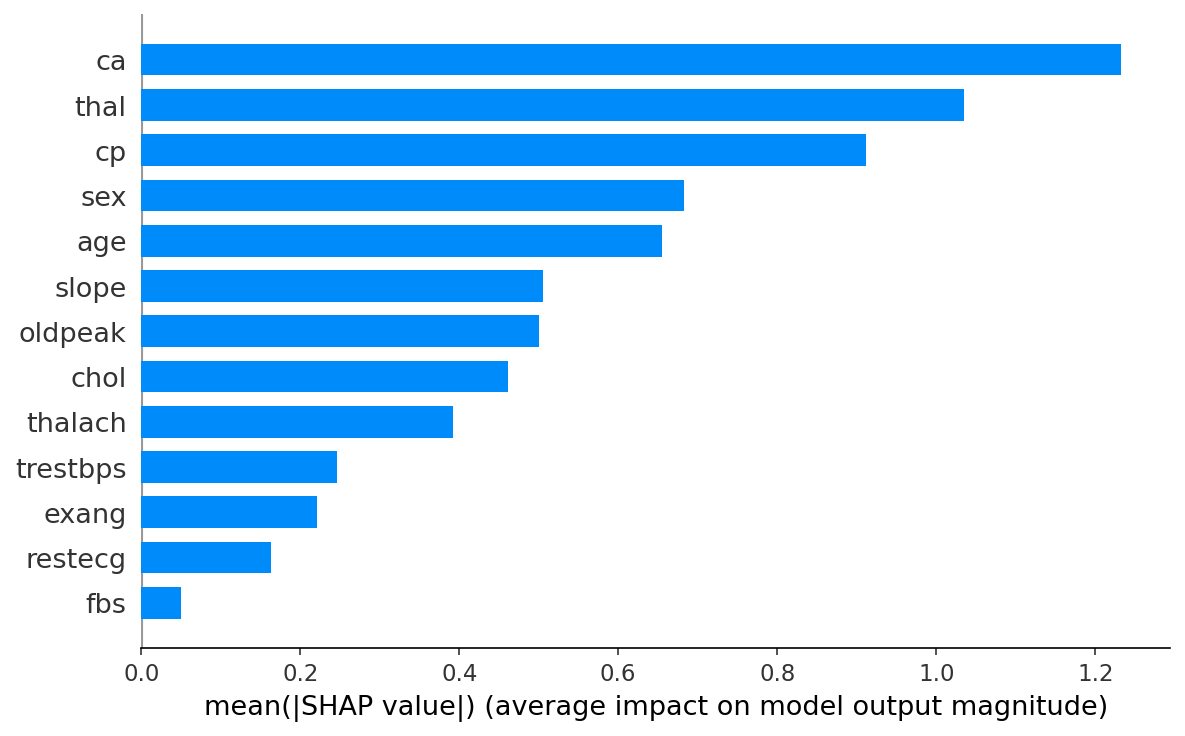
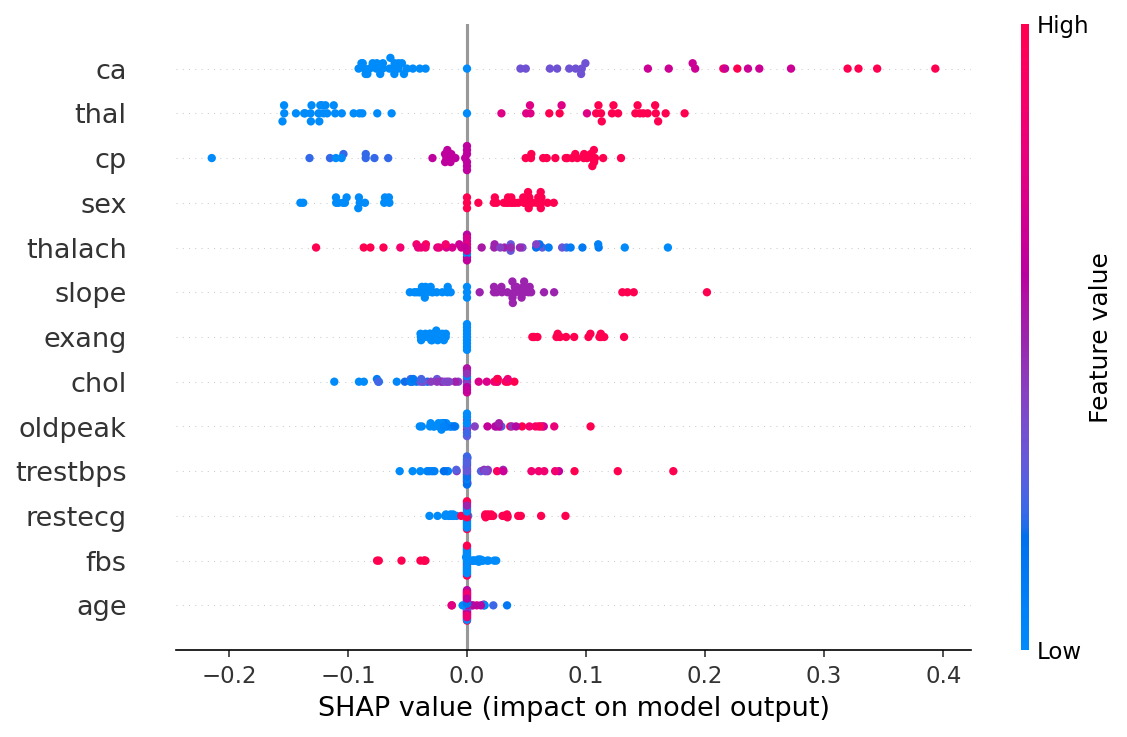
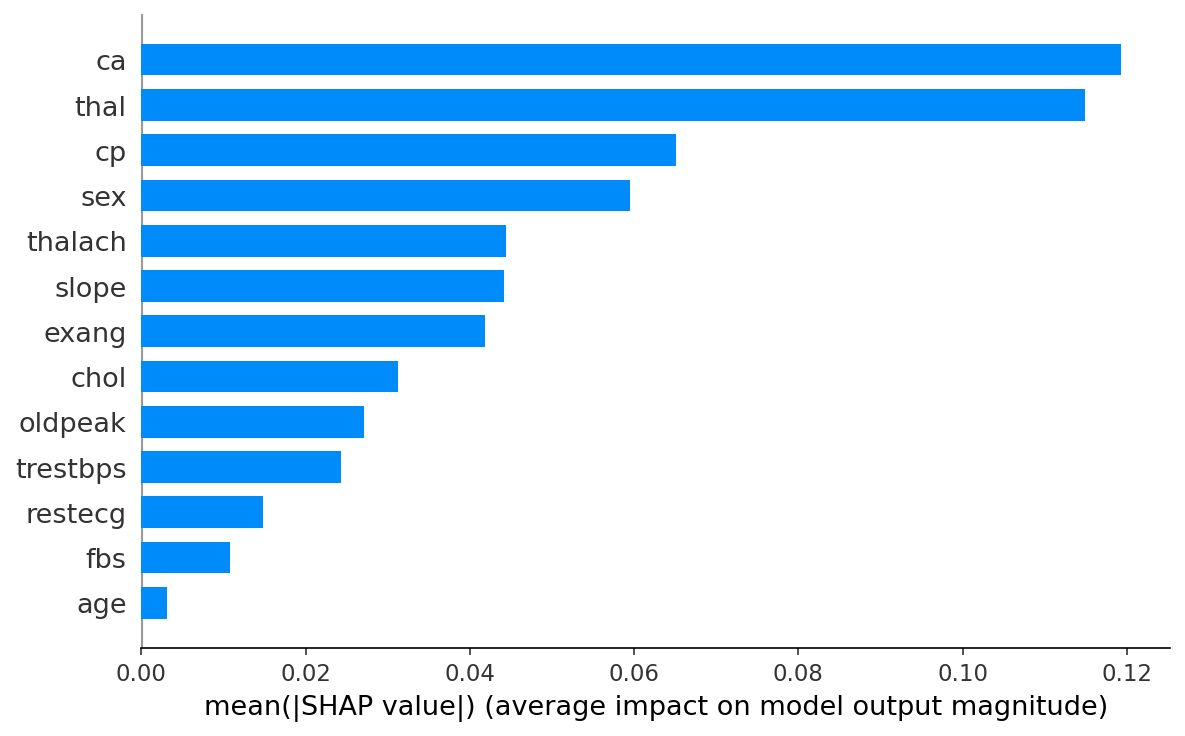
5. Explainability methods
- SHAP. Tree (RF, XGBoost), Linear (LR), Kernel (NN). Per-prediction and global mean |SHAP|.
- LIME. Local linear surrogate at every prediction (600 perturbation samples).
- Gradient × Input. Vanilla saliency for the neural net (sigmoid-output gradient).
- Comparison. Spearman rank correlation between SHAP and LIME, top-3 feature overlap.
6. Known limitations & biases
- Cohort bias. Cleveland subset is from a single US clinical site (Cleveland Clinic, 1980s). Performance on other populations is uncharacterized.
- Sex imbalance. ~68% male / ~32% female; estimates for women are derived from a smaller sample.
- Missing modalities. No HDL, LDL, smoking status, family history, or BMI, all features known to be cardiovascularly important. The Framingham comparison panel uses dataset proxies and documented assumptions.
- Reverse causality. Some features (oldpeak, exercise angina) are themselves disease manifestations, so attributions partly reflect "disease present today" rather than long-term risk drivers.
- Out-of-distribution risk. Sliders allow values outside the training range; predictions in those zones are extrapolations.
- Temporal model. Cleveland labels are prevalent, not incident, so the temporal projection is age-conditional risk extrapolation, not true survival modeling.
7. Citation
Generate a properly-formatted citation in your preferred style.
Example (APA, 7th ed.):

Kaushik, A. (2026). Rheocor v3.0: An explainable cardiovascular risk
ensemble [Computer software]. https://github.com/aryavkaushik/rheocor

Click a button above to copy this in APA, MLA, or BibTeX format.
Kaushik, A. (2026). Rheocor v3.0: Technical Summary. Available at /static/rheocorpaper.pdf.